New Consumer Power Quality Index Reveals the Best and Worst of the Grid

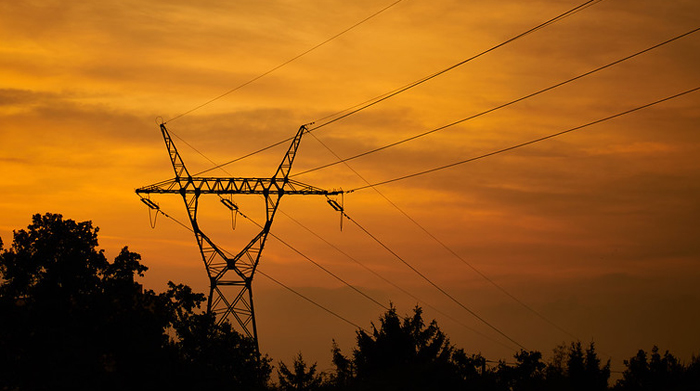
Image courtesy of Radek Kucharski under Attribution 2.0 Generic (CC BY 2.0) License, resized to 700 x 391 pixels.
A new report from Whisker Labs – the Consumer Power Quality Index (CPQI) – features good and bad news when it comes to power quality across the U.S. The report utilizes sensor data to understand the quality of the electricity being delivered to homes by major U.S. electric utilities. The first CPQI was created in August 2022, and the report card will be updated every month going forward. Let’s take a look into the inaugural report’s findings.
The Highs and Lows of the Consumer Power Quality Index
First off, it’s important to know that the index is derived by analyzing a plethora of data points. The Consumer Power Quality Index summarizes key power quality indicators measured by Whisker Labs? Ting Sensor Network, which already includes over 150,000 sensors and is set to increase to 1.5 million next year. It measures daily grid faults, as well as potential issues around power equipment and infrastructure.
So, how did the country’s major electric utilities rank on the inaugural report? Well, apparently a lot of it depends on geographic location. For example, the 5 highest-ranking utilities are mostly located in the western part of the U.S. – Nevada Power, Portland General Electric, Sacramento Municipal Utility District and San Diego Gas & Electric, with the geographic outlier being Idaho Power. This was somewhat surprising to me, given the drought and wildfire activity the region has been suffering through in recent years.
Conversely, the 5 worst-performing companies are either located in Florida or in the Midwest: Florida Power & Light, Duke Energy Florida, Tampa Electric, Centerpoint Energy (Indiana, Ohio, Louisiana, Minnesota, Mississippi, and Texas), and Commonwealth Edison (Illinois). Reasons for the low score include a higher frequency of power surges, brownouts, and outages. Florida also sees the most annual lighting strikes every year, further exasperating the issues.
It?s interesting stuff for sure. It will be interesting to see how the findings trend over time, especially 12 months from now when a lot more sensor data will be available. In the meantime, the low-ranking utilities have some work to do.


